 Remote visualisation
Overview
- Visualisation
- Remote visualisation
- Visualisation with ParaView
- Visualisation with VMD
Visualisation
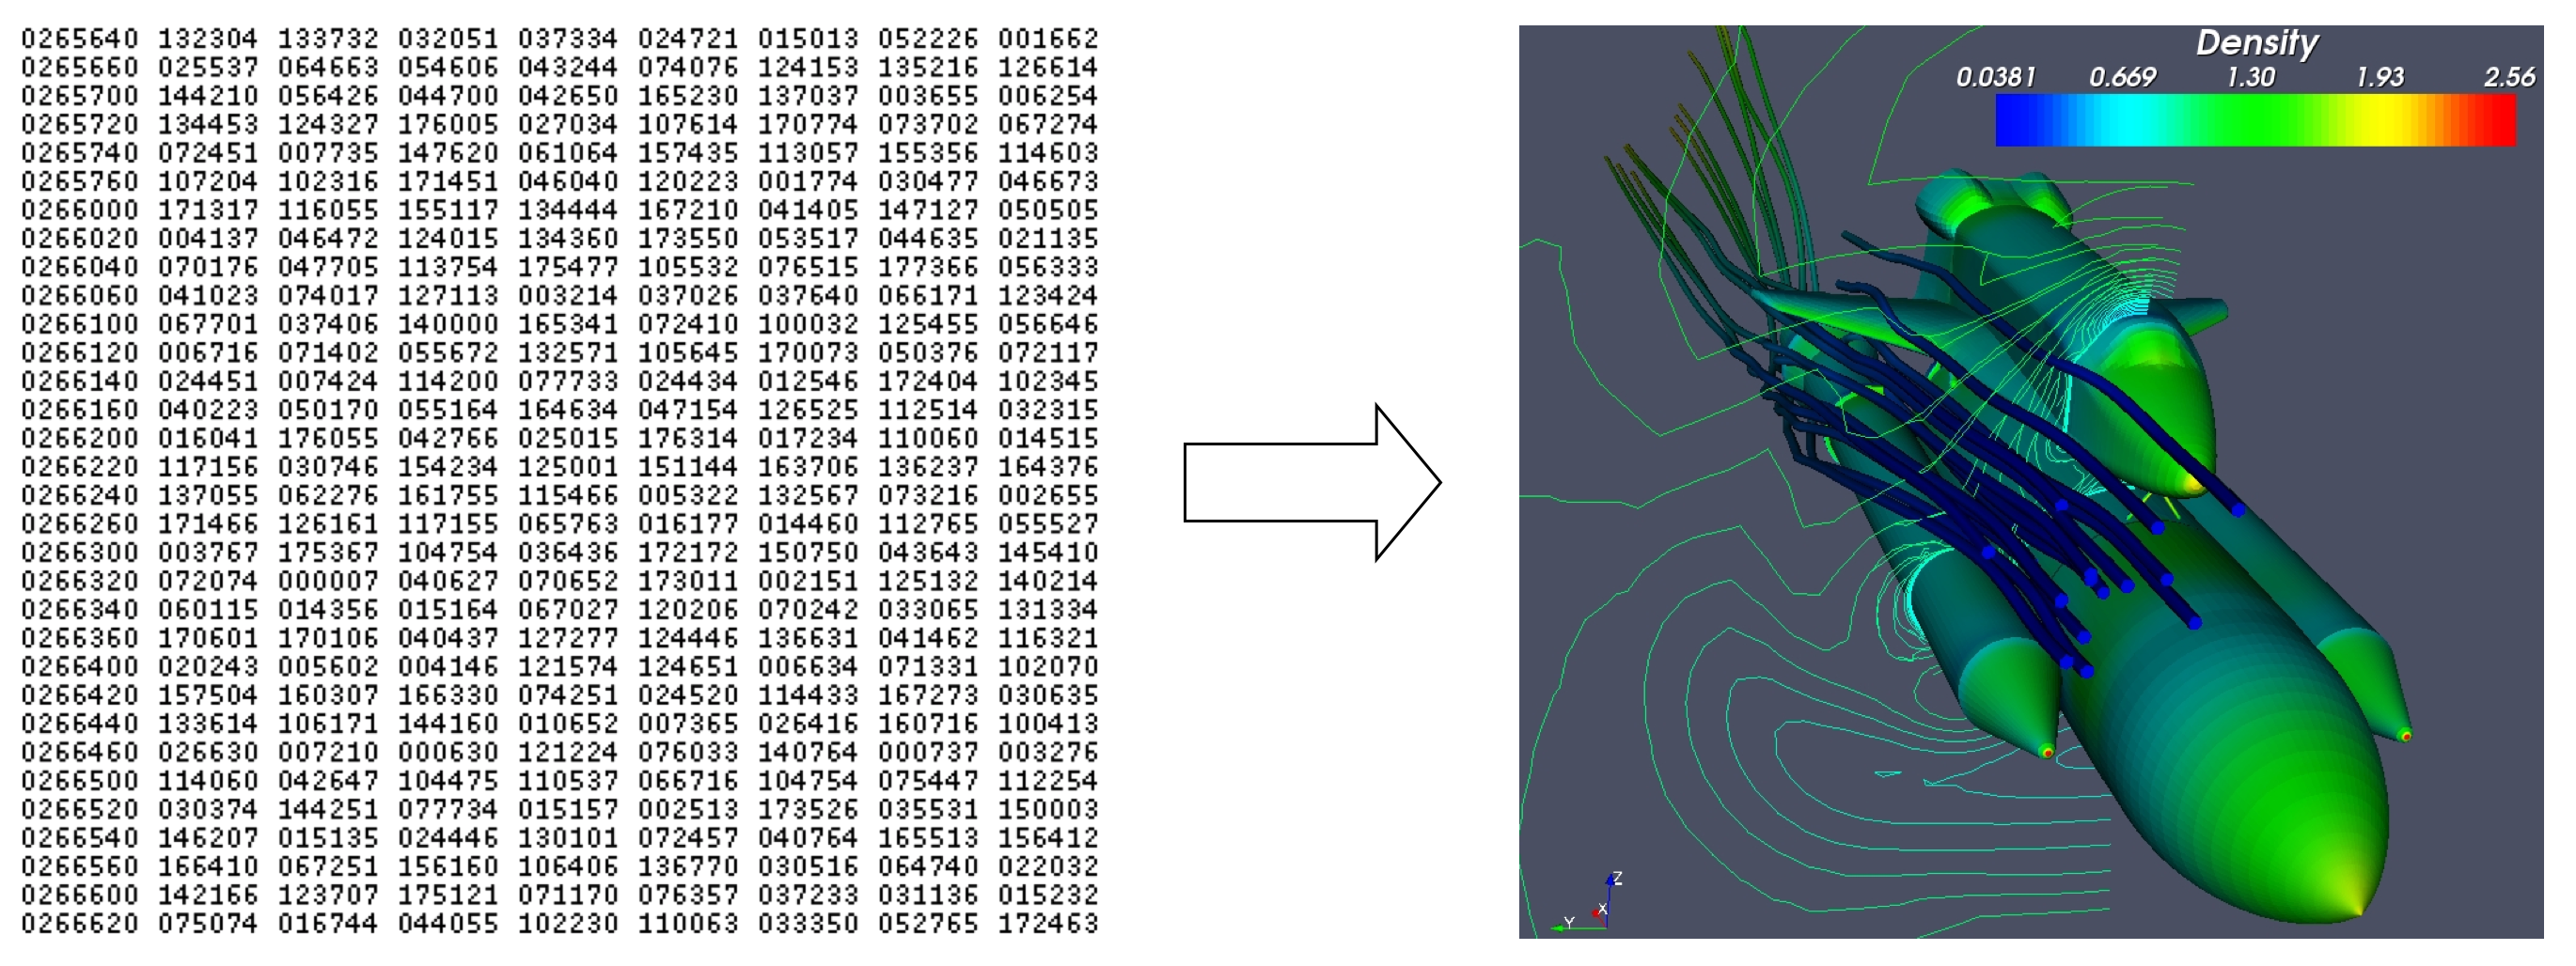
What is Visualisation?
- Visualisation offers a "method for seeing the unseen"
- Its aim is to improve understanding by representing data in a way that the important features can be seen and intuatively understood by humans
- With the increasing size of simulation data, visualisation has become mandatory to exploit the high level of detail available in such large data sets
Why do we Need to Visualise?
"The purpose of computing is insight, not numbers" Richard Hamming (1962)
Why do we Need to Visualise?
"Computing, and in particular supercomputing, without visualisation, is like assembling a jigsaw puzzle in the dark" Richard Weinberg (1988)
Remote Visualisation
What is Remote Visualisation
- Remote visualisation is simply the method of running your visualisation workflow on a remote machine
- Creates an interactive remote desktop on an HPC system
- Remote machines can be any OS, you aren't restricted by your laptops OS
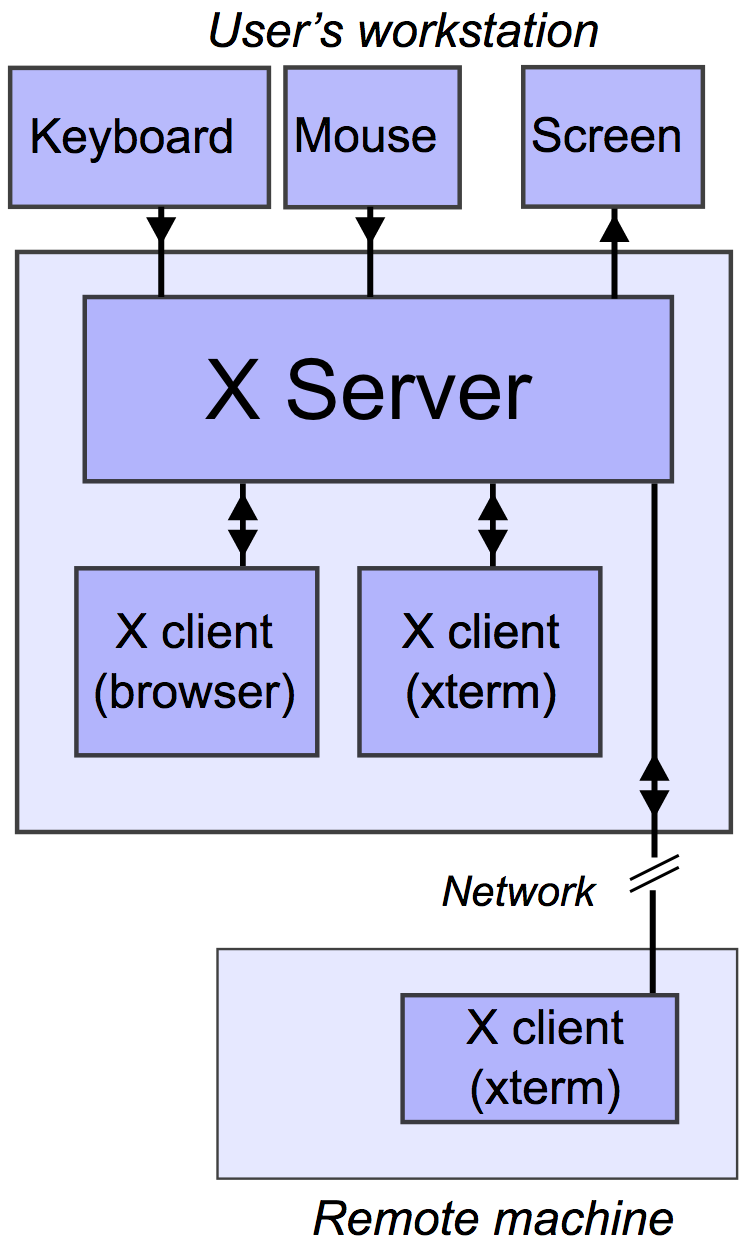
Old Style Remote Visualisation (X11 Forwarding)
- Version 11 of the X window system - X11
- X Server runs on the local machine
- X11 forwarding forwards the X11 packets from the remote machine to your local screen
- The server accepts requests for graphical output (windows) and sends back user input (from keyboard, mouse, or touch screen)
- X11 packets can be forwarded through SSH (secure shell)
- Any X11 programs started will then go through an encrypted channel
- X11 remote visualisation is no longer officially supported on pawsey remotevis platforms
X11 Forwarding Limitations
ssh -X user@server.com.au
module load mesa
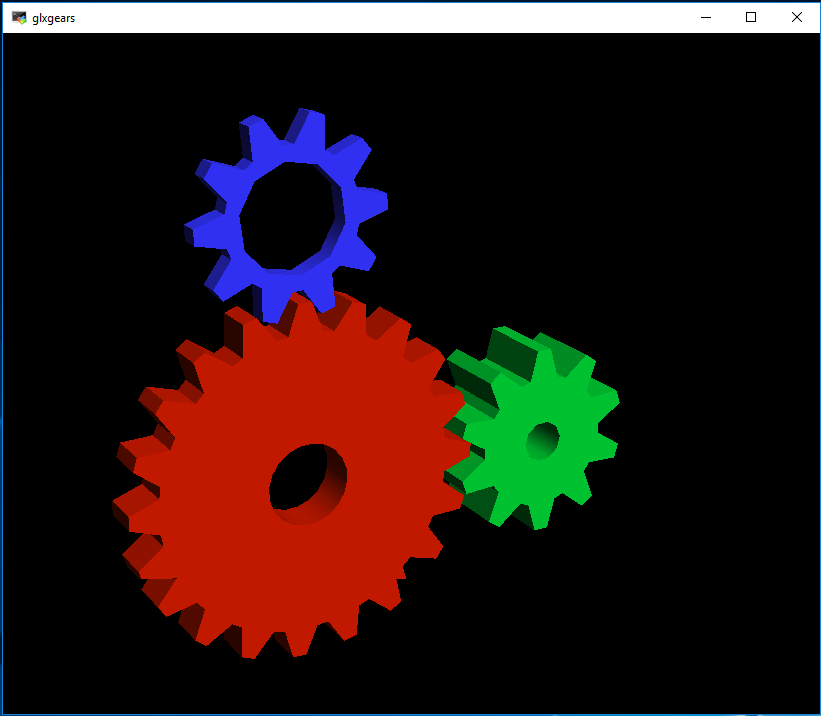
glxgears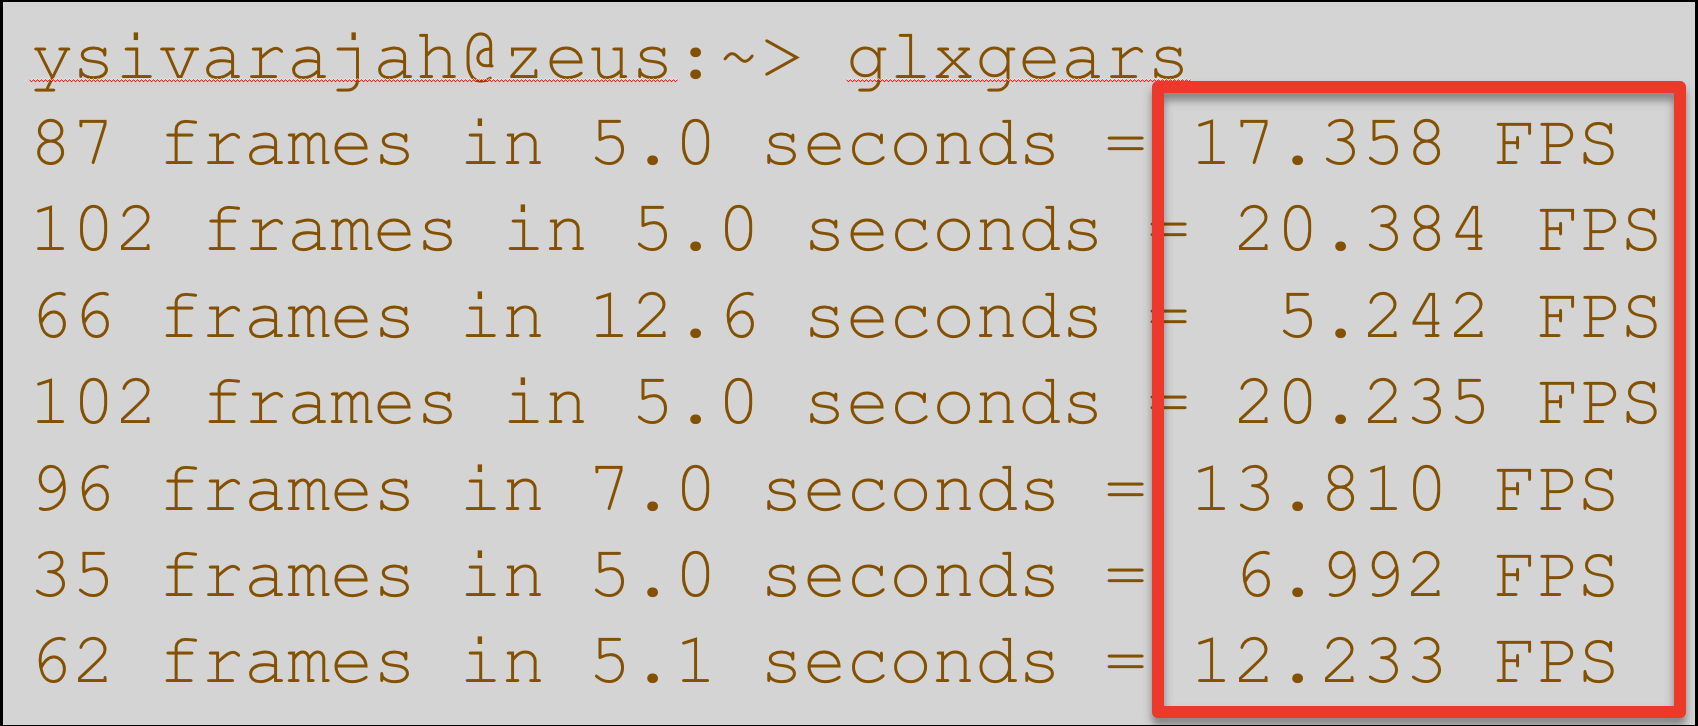
- Cannot be distributed easily on a cluster (user chooses the server)
- Runs on a single core and does not make use of the GPU
- Very slow compared to other modern remote visualisation techniques (eg. Virtual Network Computing - VNC)
- X11 forwarding will stop once your connection is broken
- Poses security hazard when used in untrusted environment
Web-based Remote Visualisation at Pawsey
Remote Visualisation Infrastructure at Pawsey
- Performed on Setonix
- 31 Nodes
- 2x AMD EPYC 7713 Milan CPU 64 cores, 2.0GHz base clock, 3.675GHz boost clock
- 512 GB RAM
- 8TB NVME SSD
- Nvidia A40 (Ampere) with 48 GB GDDR6 ECC Memory
- 200 Gb/s Slingshot interconnect
- Shares the same file systems with other Pawsey supercomputers
- /home - for storing user config files
- /scratch - for temporary storage of large research data and simulation output
- /software - for compiled software
- This avoids the need to copy simulation data across systems or outside of Pawsey
Why use Remote Visualisation
Hands on Session
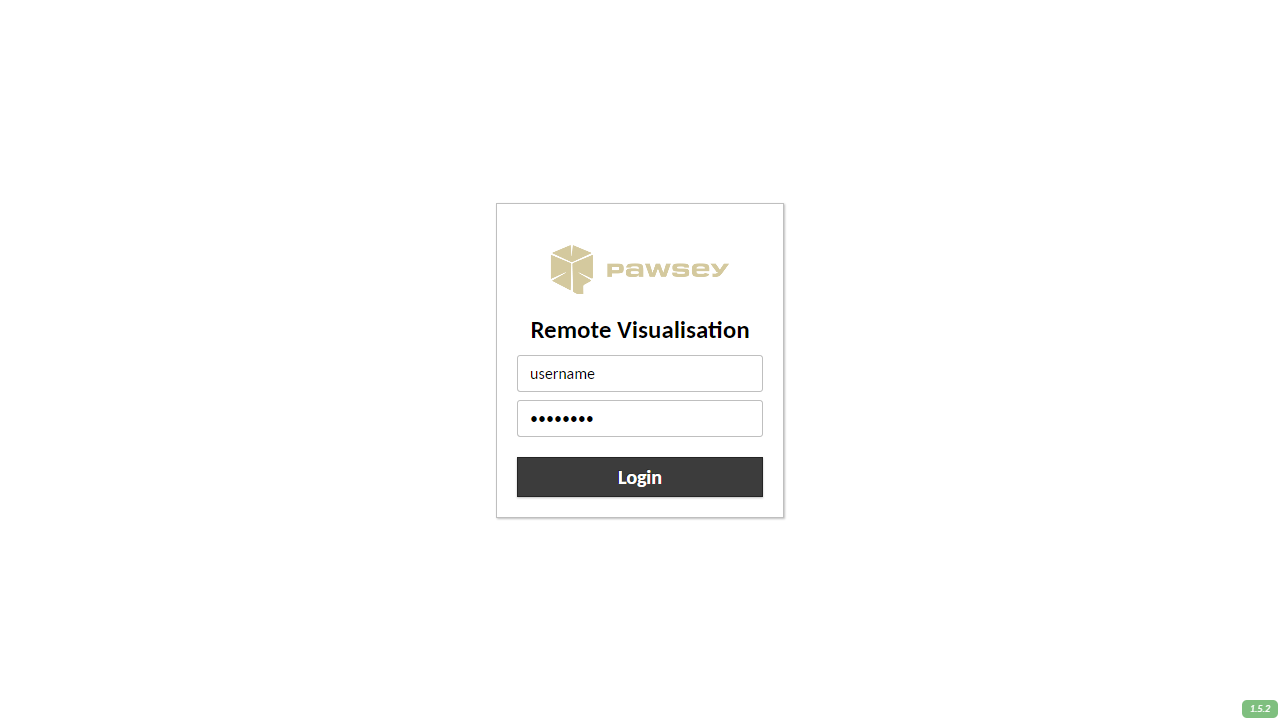
Starting a Remote Visualisation Session
- Open your preferred browser (e.g. Chrome, Firefox) and goto: vis.pawsey.org.au/remotevis
- You should be assigned a node and directed to a remote desktop session automatically:
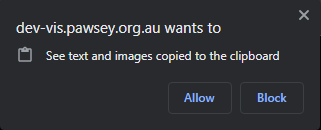
Permissions
- When connecting for the first time with a new browser, you will be asked for clipboard access. You must allow this in order to copy/paste text between your local machine and the remote session
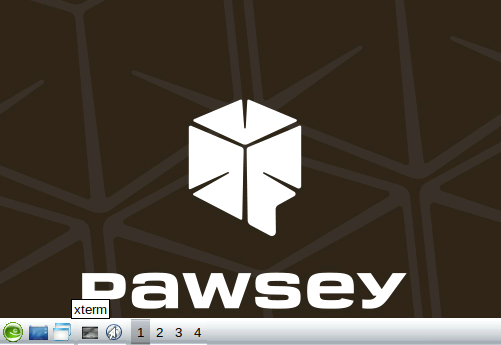
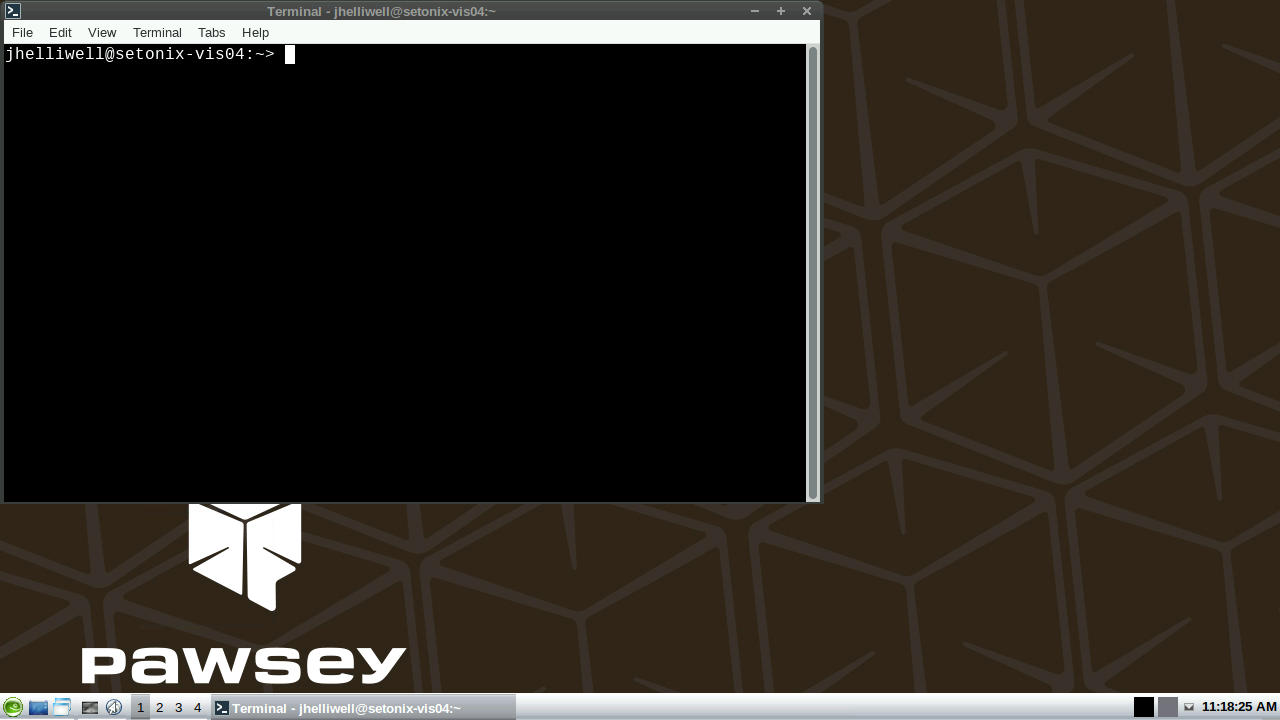
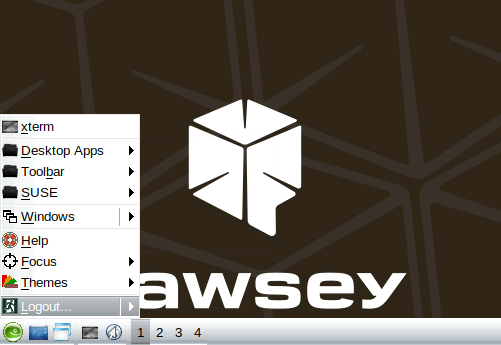
Launching the Terminal
- Cick on the terminal icon in the bottom left toolbar
- Once you have clicked on the button, a terminal window will open:
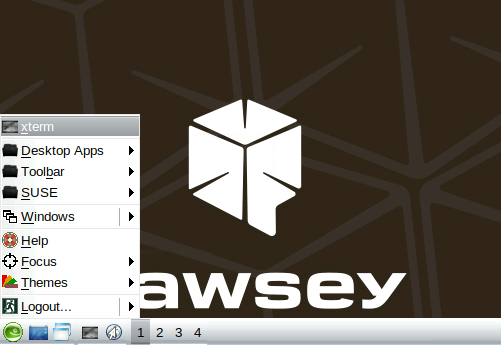
Application Drawer
- The terminal and other applications can be found in the application drawer which can be accessed by clicking the apps button in the bottom left, or right clicking on the desktop:
Accessing the Sidebar
- To access the sessions sharing and settings for the remote session, press:
Ctrl + Shift + Alt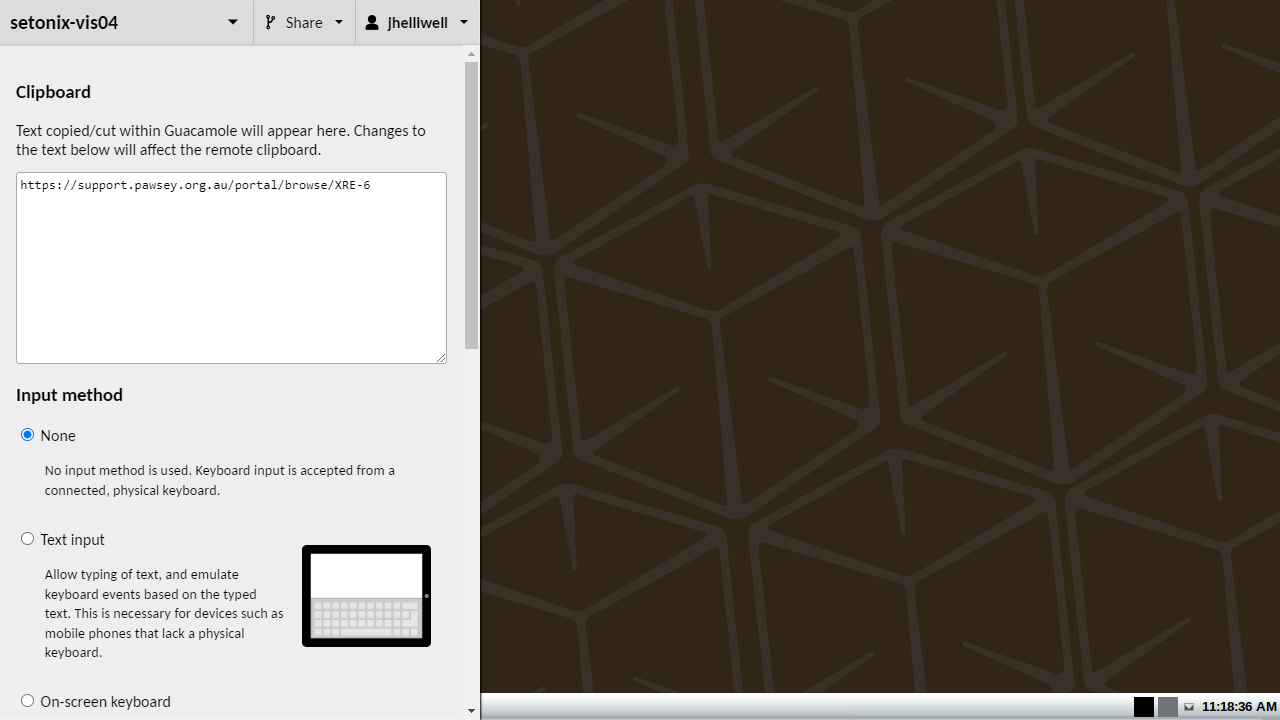
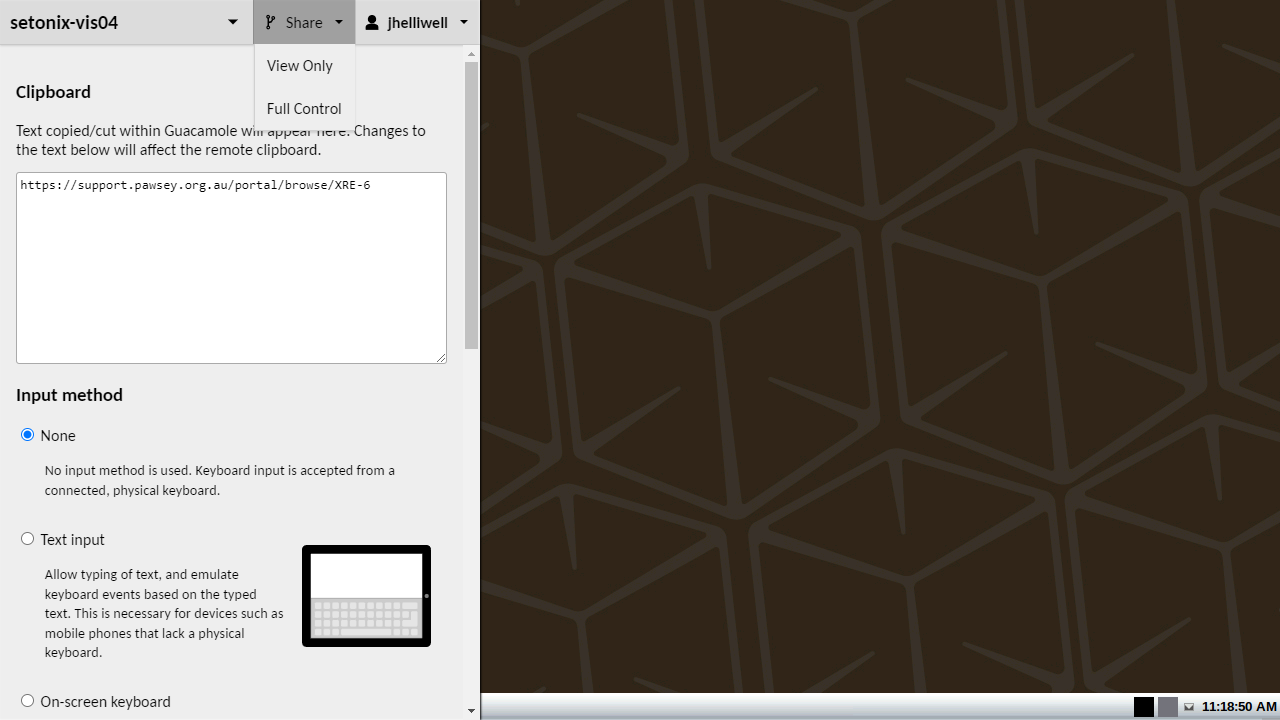
Sharing Your Session
- Sharing can be found at the top of the sidebar
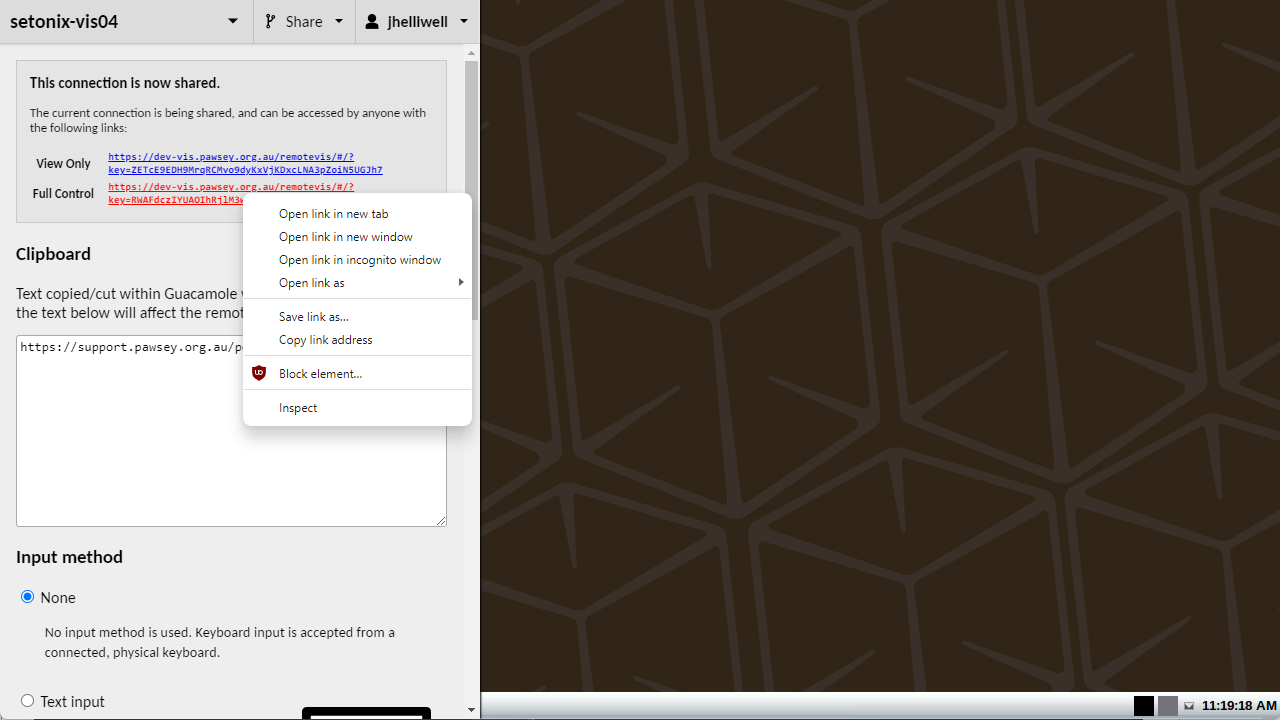
- Links can be generated for both view only and full control
- Copy the desired link and share it with your collaborators
Terminate the Session
- Each session should be terminated after use to free up resources for other users. Sessions will be automatically terminated after 8 hours
- To end a session, open the app drawer and select logout:
Questions?
Break-out room (hands-on session) will start soon
Questions?
Presentation will continue shortly
Visualising Using ParaView
ParaView
- Open-source, cross-platform data analysis and visualisation application
- Has a user-friendly interface built on top of the Visualisation ToolKit (VTK) library
- An extensible, modular architecture based on open standards
- Mainly used to analyse large datasets (petascale size) using distributed-memory computing resources
- Supports a wide range of data formats
Domain Specific Supported Data Types
Structural Analysis
- Ensight
- Exodus
- LS-Dyna
- Spyplot
- Tecplot
- XDMF
Fluid
Dynamics
- CGNS
- Ansys
- Chombo
- Exodus
- Fluent
- Nek5000
- OpenFOAM
- Plot3D
- Tecplot
- XDMF
Astrophysics
- Calculator filters
- CosmoReader - Cosmo and Gadget2 particle formats
- Demand driven AMR slices
- Enzo Reader - AMR astrophysics simulations
- Flash Reader - AMR astrophysics simulations
- GenericIO - HACC cosmology particle formats
- GPU rendered point sprites in the Point Sprite Plugin
- HOP Halo finder filter from the yt plugin
- LANL Friend of Friend Halo finder filter
Climate Science
- Batch python scriptability
- Client/Server remote visualization of large datasets
- CAM reader
- GDAL reader
- MOC reader
- MPAS reader
- NetCDF (CF) reader
- Python Programmable filter
- Unstructured POP reader
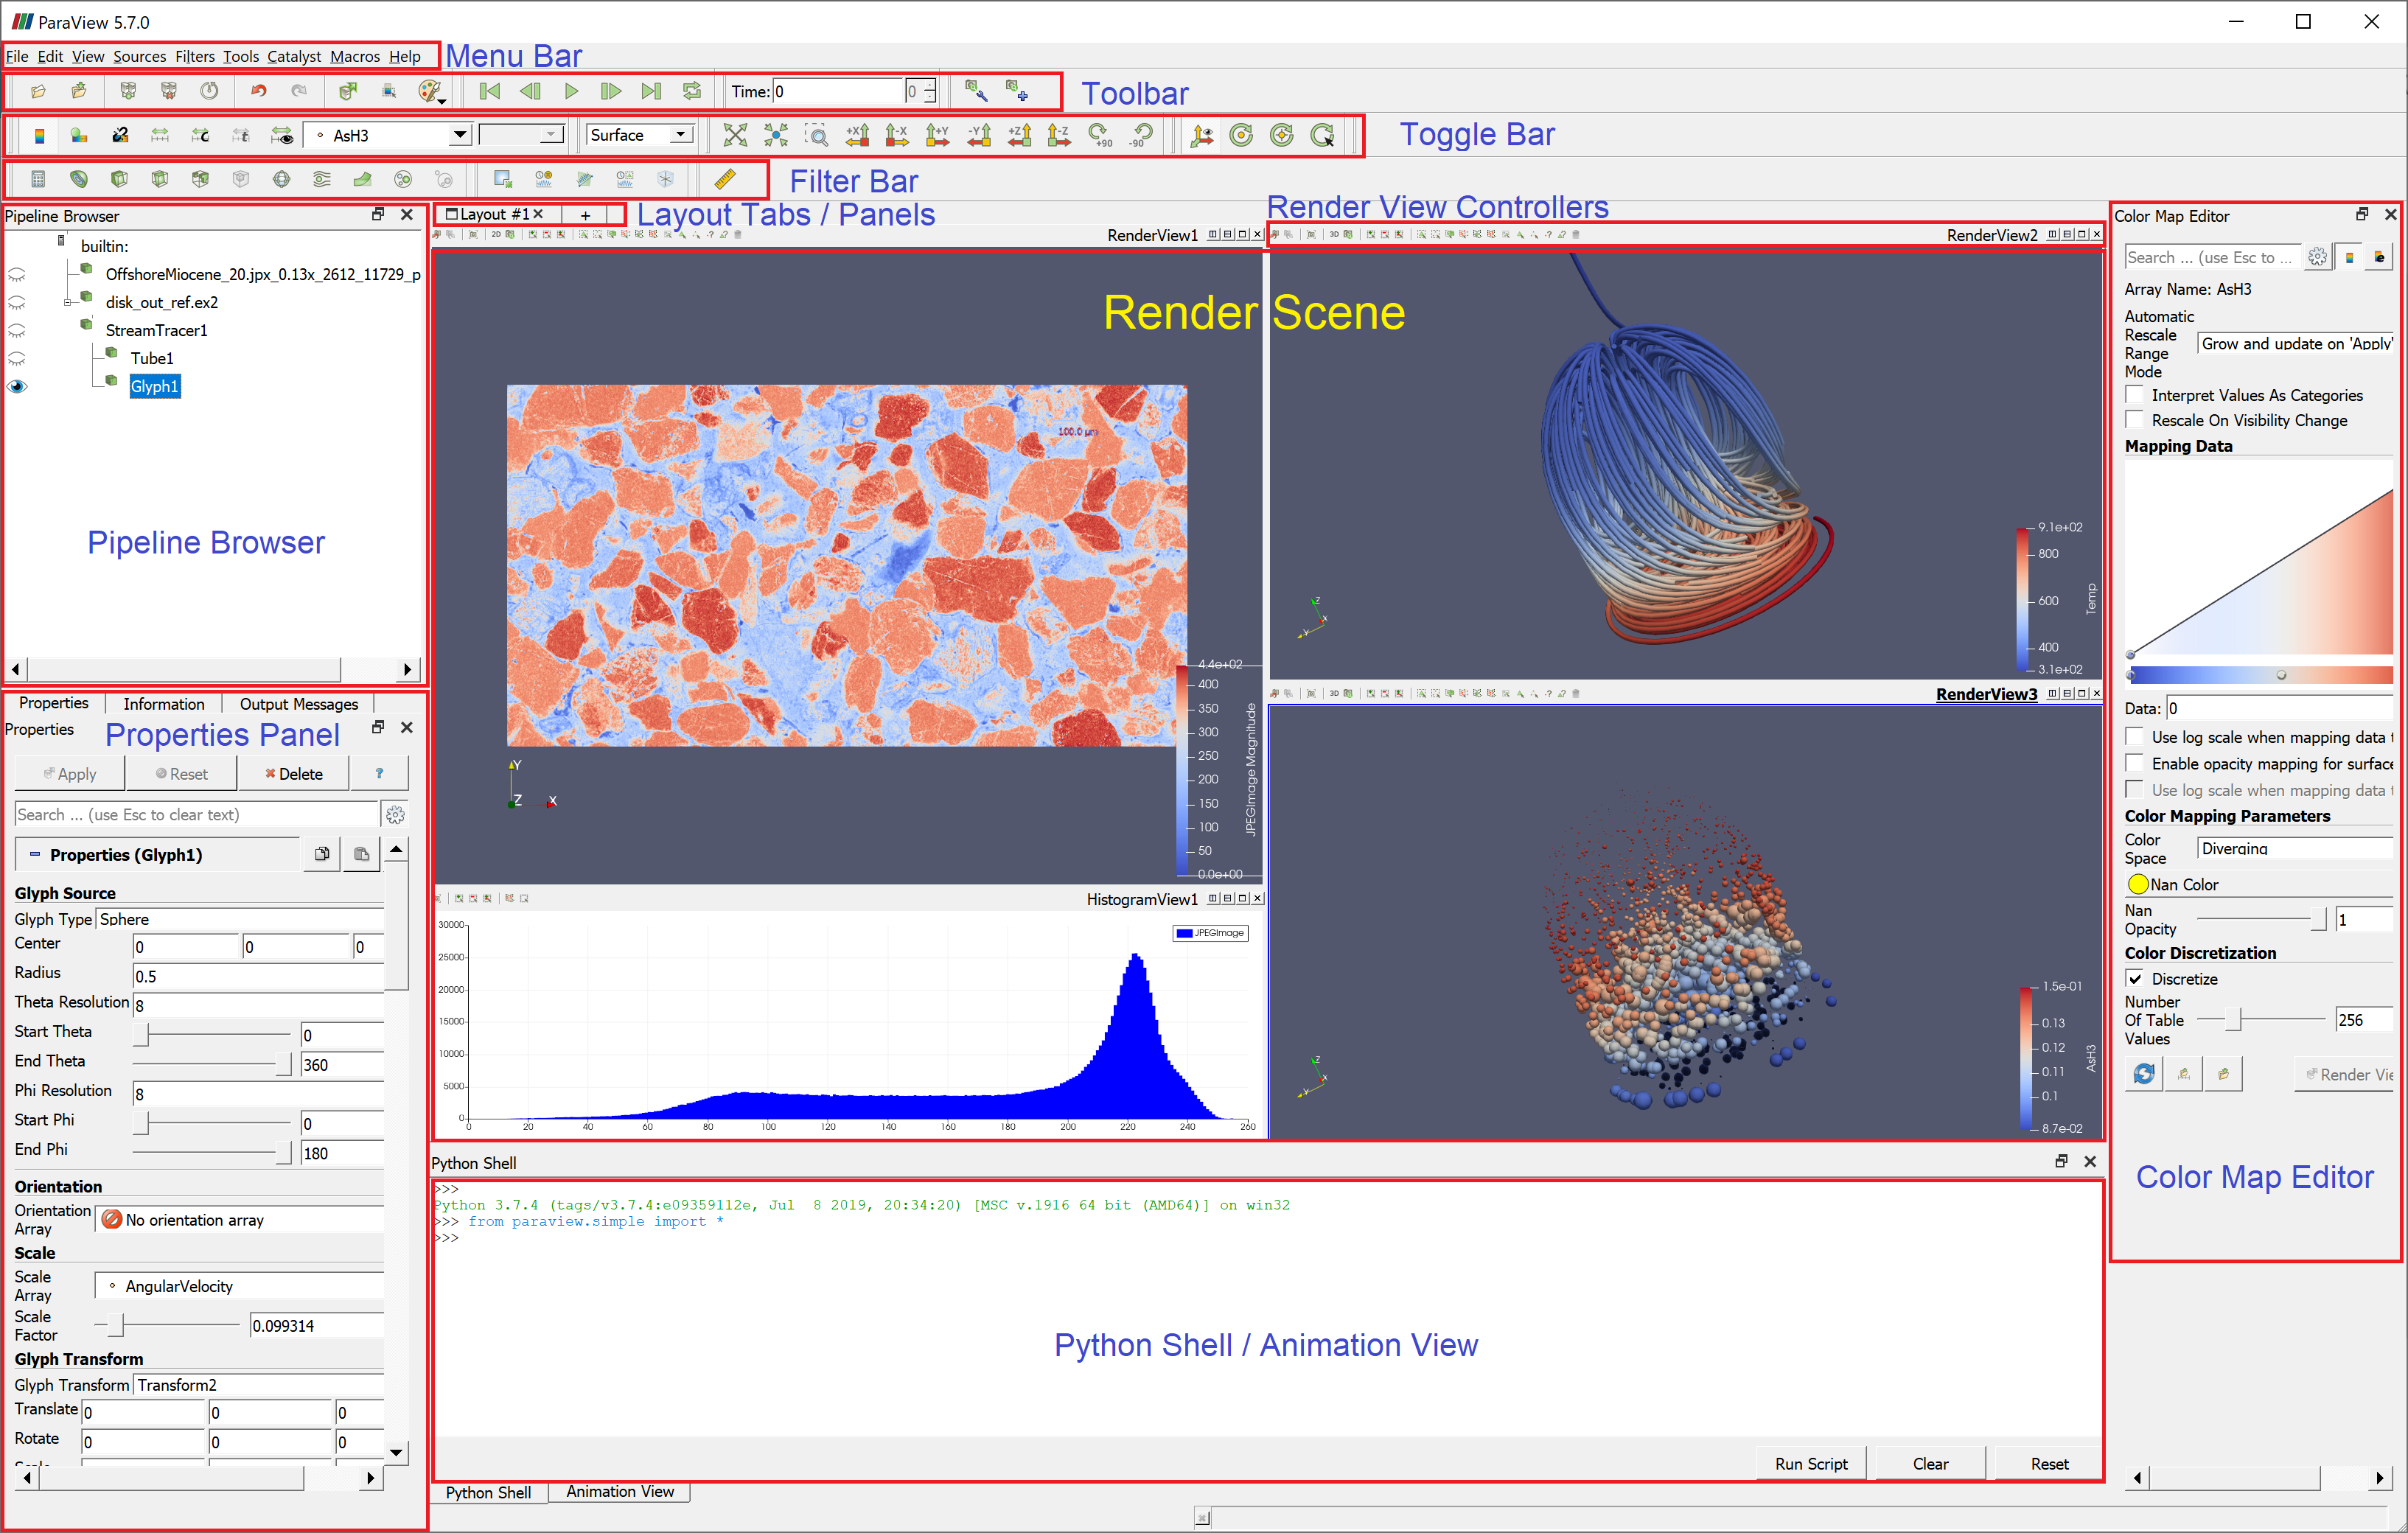
ParaView Interface
ParaView Distributed Mode
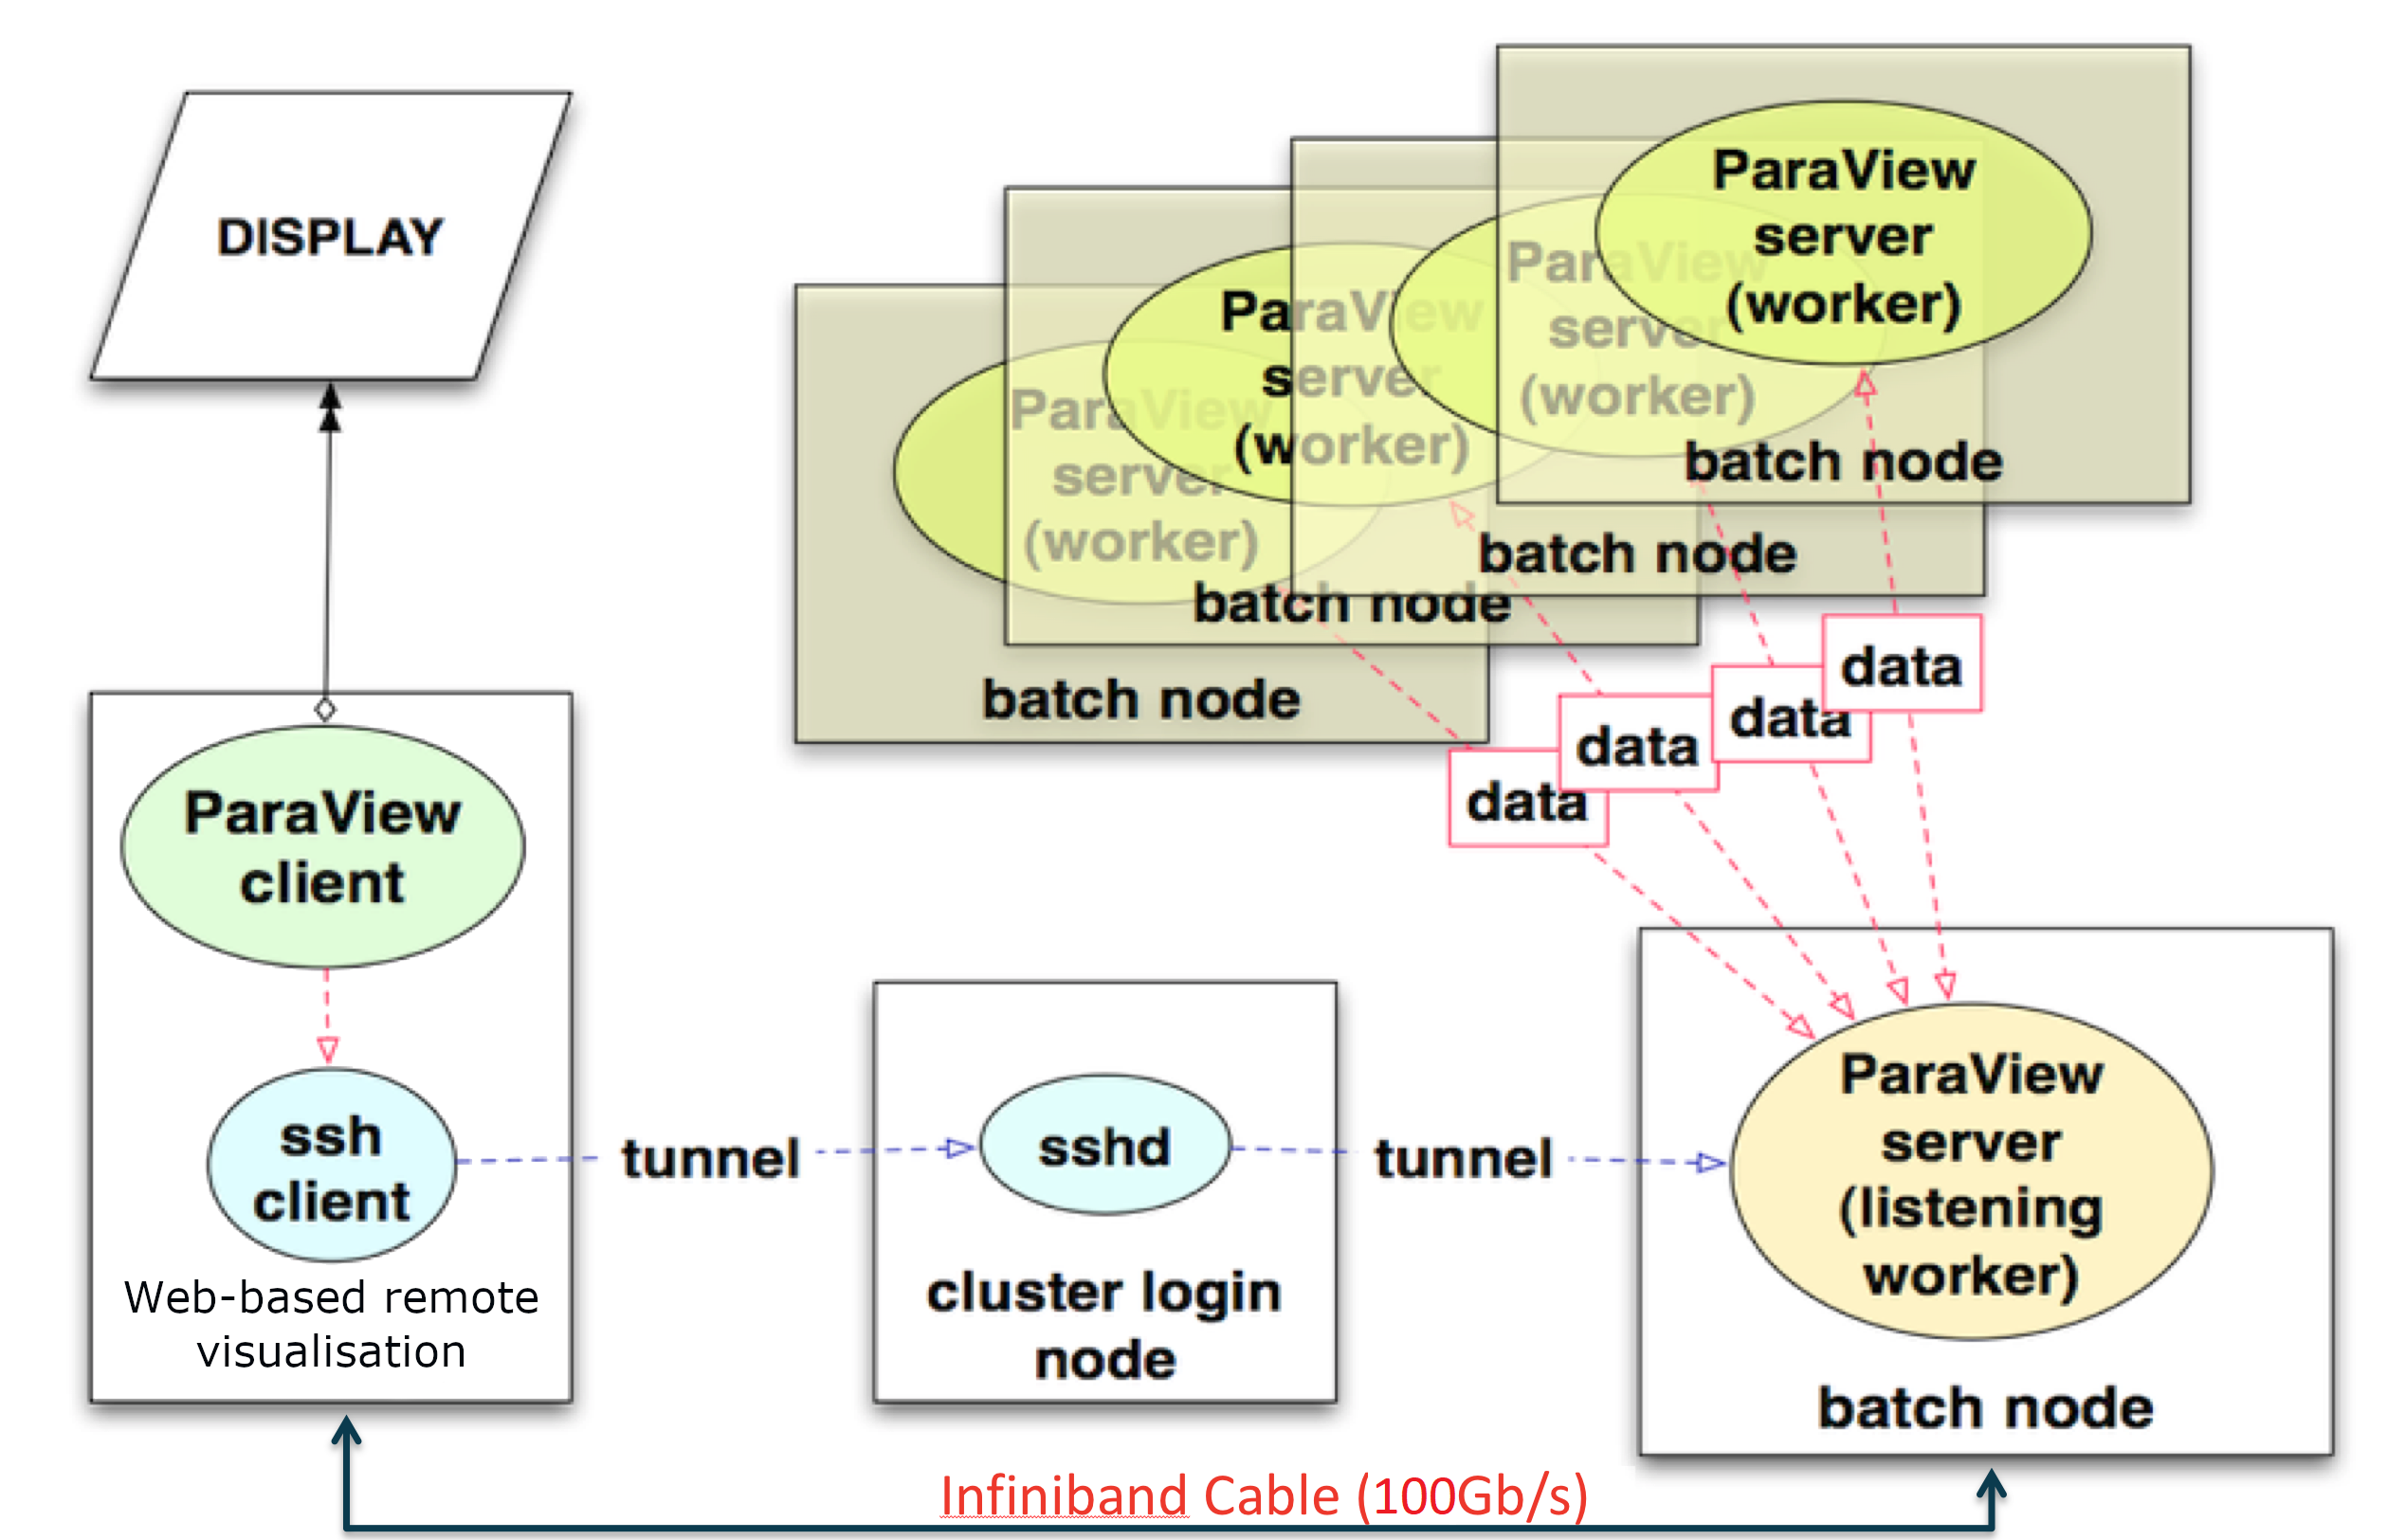
Running ParaView in Distributed Mode
- Click connect to server button in the main toolbar
- A list of pawsey servers should be preconfigured
- Check the xterm window for a password prompt if one does not appear
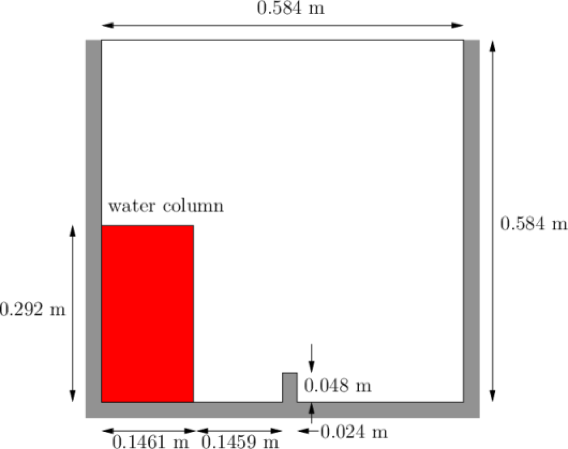
Visualisation of Dam Break Simulation Using ParaView
- Column of water behind a membrane
- At t = 0s, membrane is removed, then:
- column of water collapses
- water impacts an obstacle
- creates a complicated flow structure
- 100 total timesteps
Visualisation of Dam Break Simulation Using ParaView
Visualising Using VMD
High-Performance
Molecular Visualisation Tool
- Molecular dynamics simulations
- Lattice cell simulations
- Quantum chemistry calculations
- Cyro-EM dencities, volume data
- User extensible custom scripting and plugin
VMD Interface
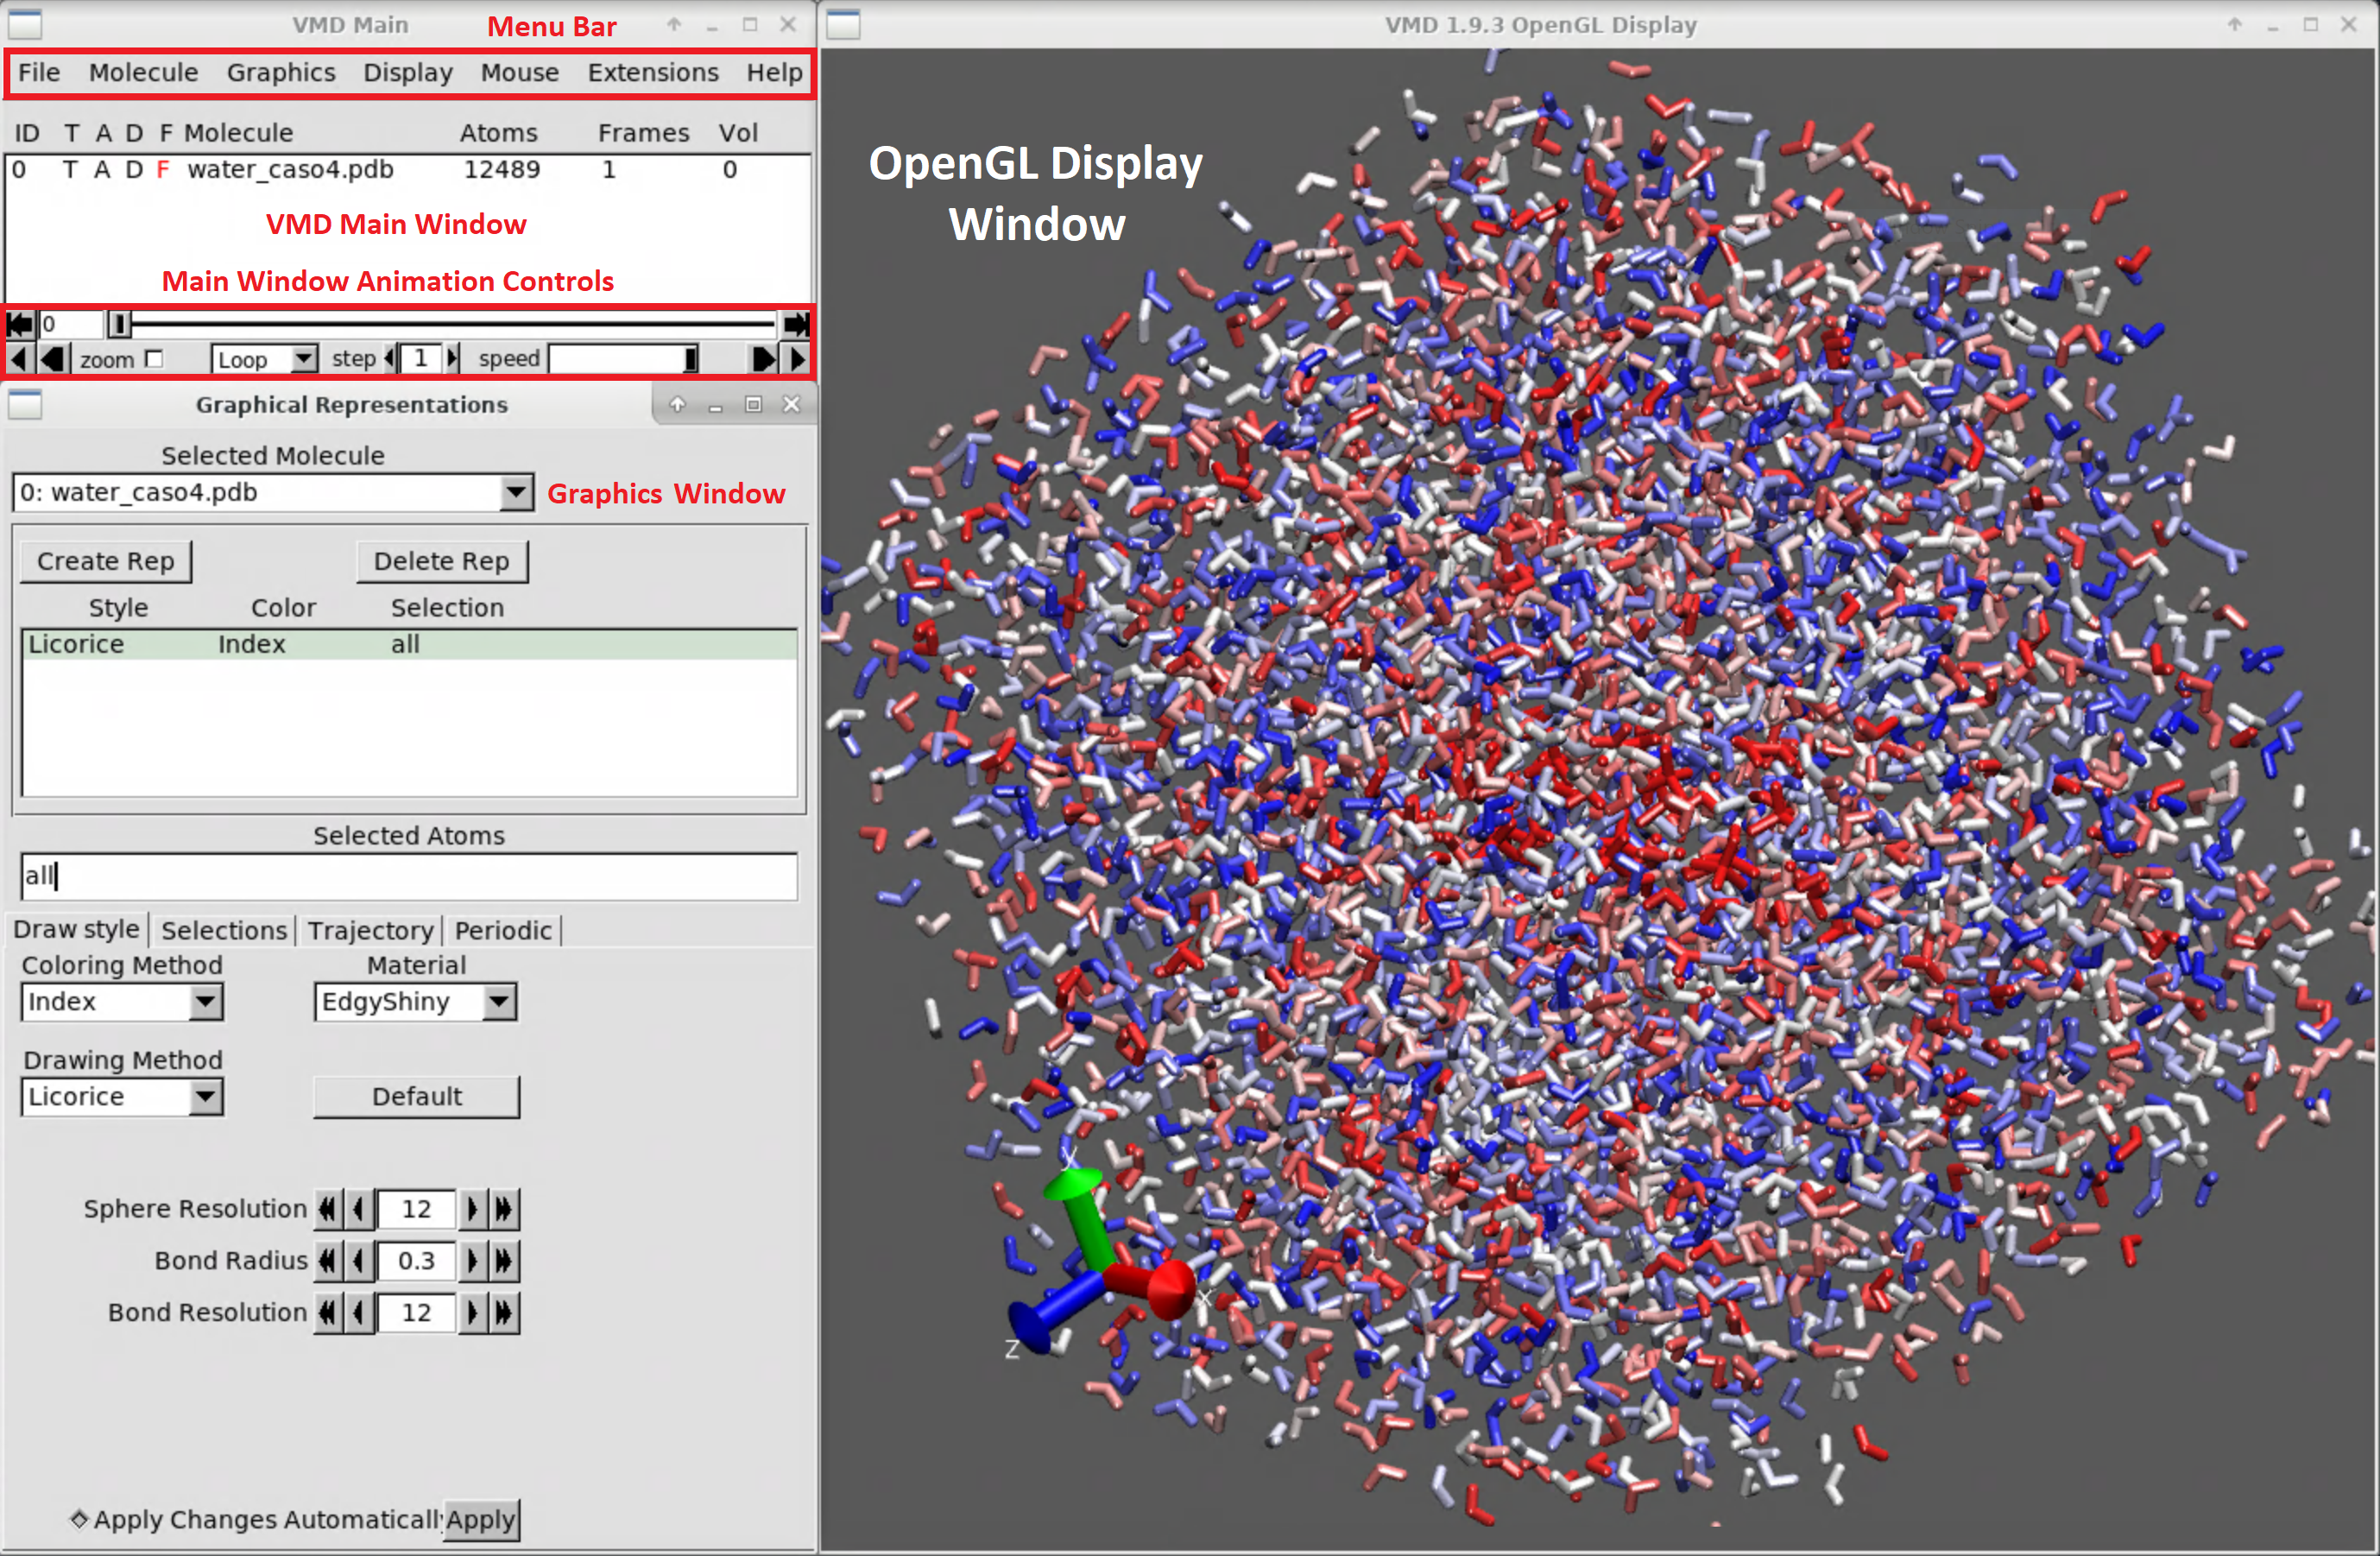
Molecular Simulation Visualisation Using VMD
Calcium carbonate is one of the most abundant minerals on Earth. It is a key component of seashells and corals, as well as scale. Better understanding its mechanisms of formation can have an impact in several regards, including the safeguard of marine life and reducing the maintenance costs in industrial plants.
Even at low concentrations (1 ion pair every 55,000 water molecules), calcium and carbonate ions in water do not remain isolated, but instead form small clusters composed of several molecules. Note how dynamic the structure of the cluster is and how often the atomic connectivity changes in the few nanoseconds represented in this movie.
Agglomeration and separation of calcium and carbonate ions (grey) in water, during atomistic simulations run on the Magnus supercomputer.
More Information and Help
Visualisation Documentation:
Contact:
visualisation@pawsey.org.au
Help:
help@pawsey.org.au